

MONITOR: a multi-domain machine learning approach to predicting in-hospital mortality
Introduction
A multitude of tasks, actions, and medical providers interact with a patient’s unique clinical characteristics throughout a hospital stay to result in an outcome. Unfortunately, for more than 700,000 patients annually in the United States (US) that outcome is death (1). Although there are validated clinical scores to predict in-hospital mortality (2-4), they require manual data entry—a time and labor-intensive process and potentially a source of error(s). Additionally, those scoring tools only allow for an analysis of data at a particular moment in time as it relates to a patient’s condition (5). Using a machine learning (ML) approach with electronic health record (EHR) data can account for the complexity and number of fluctuating inputs to better predict and reduce in-hospital mortality.
While many open-source ML algorithms for predicting in-hospital mortality exist, to date, they were developed using the Medical Information Mart for Intensive Care III (MIMIC-III) publicly available dataset (6-12). Data in MIMIC-III comprise patients admitted to the intensive care unit (ICU) at a single hospital (13), thus restricting the use of the open-source models to the intensive care setting and limiting the ability to apply them to the general care floor setting. The current literature indicated that many ML approaches focused on mortality due to specific conditions (14-16) and after specific procedures (17-19). With nonspecific diseases being the fifth underlying cause of death for inpatient hospital mortality (20), ideally a model would predict mortality beyond a particular condition or procedure. Additionally, certain patients admitted to a non-ICU can be at risk for rapid deterioration (21,22), and therefore merit further attention. Besides reviewing the patient’s mortality risk at triage or admission (23,24), an ideal model would continuously evaluate the mortality risk through the patient’s admission, given that more extended hospital stays are more prevalent in patients who died in the hospital (1). Indeed, ICU mortality prediction is more accurate with a continuous model than static scoring or prediction (25).
Given the limitations of static validated scoring systems and existing open-source models, the objective of this study was to develop a machine-learning (ML) model that predicts in-hospital mortality throughout a patient’s hospital stay, regardless of the patient’s specific cause or location of admission. We present the following article in accordance with the TRIPOD reporting checklist (available at https://jmai.amegroups.com/article/view/10.21037/jmai-21-28/rc).
Methods
Setting, participants & outcome
University of Florida (UF) Health system has two campuses in Northeast Florida. UF Health Jacksonville (UFHJ) is a teaching hospital and level 1-trauma center and UF Health North is a community hospital with an outpatient medical complex. The hospitals combined have 695 licensed beds with approximately 33,000 admissions annually. UF’s Institutional Review Board approved the study, and an honest broker at the UF Integrated Data Repository (IDR) extracted the data. This study adheres to the TRIPOD (Transparent Reporting of a Multivariable Prediction Model for Individual Prognosis or Diagnosis) guidelines for prediction model development. We utilized EHR for patients having an inpatient hospital visit from January 1, 2014 to January 30, 2020. Records were excluded for patients who were less than 18 years old at the time of encounter. Records for inpatient visits were also excluded if the length of stay (LOS) was less than one day or greater than 365 days. For patients with multiple inpatient visits, only the most current visit was kept.
The primary outcome of interest was in-hospital mortality. A patient was determined to have the outcome ‘died in hospital’ if they had a recorded death date equal to the discharge date of their inpatient visit. Patients were split into training and testing sets using an 80/20 split of the data stratified on a combination of outcome and total hospital LOS. Figure 1 details the cohort selection and exclusion criteria. The training data utilized the total data available for the patients up until the day before discharge or death. For the patients in the test data, we created observations and predictions for each day the patient was in the hospital using data available up until that day.

Ethical statement
The study was conducted in accordance with the Declaration of Helsinki (as revised in 2013). The study was approved by University of Florida’s Institutional Review Board (IRB201903477) and individual consent for this retrospective analysis was waived.
Software
The model was developed with Python Programming Language (RRID:SCR_008394). Packages used in data cleaning and manipulation were Pandas (RRID:SCR_018214), NumPy (RRID:SCR_008633), and FuzzyWuzzy (RRID:SCR_021699). The dataset was split with scikit-learn (RRID:SCR_002577). Imputation of missing data was done with LightGBM (RRID:SCR_021697) and PyCaret(RRID:SCR_021695). The imbalanced dataset was resampled with imblearn (RRID:SCR_021698). The ML model was developed with Catboost(RRID:SCR_021694), and PyCaret(RRID:SCR_021695). BorutaShap (RRID:SCR_021696) was used for feature selection. Graphs and plots were created with PyCaret(RRID:SCR_021695),MatPlotLib (RRID:SCR_008624), and Plotly (RRID:SCR_013991).
Data variables
Data utilized included demographics, emergency department and inpatient medications, laboratory (lab) data, procedures, and other orders. We also utilized tobacco use history available from the EHR. For each patient, the last available record for demographic data and tobacco use history were used. Inpatient consults were mapped to a priori-determined relevant consult groups according to clinical domain expert authors (JNF & CCG). All international classification of diseases (ICD) 9/10 records were recorded after the conclusion of an inpatient visit; therefore, only ICD information available prior to the start date of each patient’s current inpatient visit is used, acting as a proxy for medical history. All ICD9 codes were mapped to ICD10 codes using the crosswalk from the National Bureau of Economic Research (26). Those codes were mapped to the clinical classifications software refined (CCSR) groupings using the crosswalk from the Agency for Healthcare Research and Quality (27). Consult and ICD features indicating end-of-life were dropped.
Medication order descriptions were cleaned and matched to a flattened version (author GPLL) of the anatomical therapeutic chemical (ATC) classification (28) using fuzzy string-matching and proofread by manual review (authors JNF, CCG, & SJD). Each ATC classification was grouped into its highest available level up to Level 4. Lab names and units were cleaned and concatenated. The variations were mapped to a priori-determined relevant labs according to authors with clinical experience (JNF & CCG). Conservative thresholds were set for outliers at the upper/lower quartiles ± 5× the training data’s interquartile range (IQR). Any value outside of that range was replaced with the threshold. Vital sign measurements [blood pressure (BP), Braden Score, heart rate, Glasgow Coma Score (GCS), pain scale, respiratory measurements, and temperature] were bounded to their appropriate clinically defined or physiologically possible ranges. Any values outside of these ranges were removed. For all labs and vitals, the first, last, minimum, maximum, mean, and standard deviations (SD) for each patient were incorporated. For labs, minimum and maximum values were replaced with an indicator of high or low using hospital lab outlier thresholds. All categorical variables were one-hot encoded.
For data from consults, demographics, ICD codes, medications, and tobacco history, all patients with missing data were assigned a value of ‘unknown’ for each respective category. All ‘unknown’ features were dropped from the dataset to reduce multicollinearity except for lab data and vital signs. For lab data, we imputed mean, first, and last values with normal physiologic values. The threshold values used in vital sign measurements and lab data are listed in Tables S1,S2 in the supplementary appendix online. SD was imputed with a value of zero. Missing vital signs were imputed during model training using mean values or an iterative imputation procedure.
Feature selection
The training and test datasets contained a combined 1,479 features. The BorutaShap wrapper method (29-31), using the CatBoost classifier with SHAP values for feature importance, was utilized for feature selection. Both accepted and tentative features were kept for a reduced feature set of 60 attributes.
Machine learning algorithm
CatBoost is a machine learning algorithm that utilizes gradient boosting on decision trees for both regression and classification. Gradient boosted decision trees have recently been used with great success across various disciplines, and CatBoost is a preferable model choice for large datasets with heterogenous and categorical data (32,33). A total of 15 different CatBoost models were trained using the default hyperparameters in PyCaret.
Statistical analysis
Models were tested with both mean and iterative imputation for missing data. Various resampling methods were explored for class imbalance such as random undersampling, random oversampling, SMOTE (34), random undersampling followed by random oversampling, and random undersampling followed by SMOTEEEN (35). The F2 measure was chosen as the metric for model selection based on its relative weighting of recall and precision. Unlike the F1 measure, the F2 measure, Eq. [1], emphasizes recall more heavily which is vital in medical applications where the cost of a false negative (predicting survival when in fact the patient dies) outweighs the cost of a false positive (misclassifying a patient as more likely to die when they actually survive).
We also reviewed accuracy, recall, precision, area under the receiver operating characteristic curve (AUROC), area under the precision-recall curve (AUPRC), and F1 score. Accuracy was measured as the proportion of all patient outcomes, both survival and death, predicted correctly. Recall was measured as the proportion of all patients accurately predicted to die out of all the patients who did die. Precision was measured as the proportion of all patients accurately predicted to die out of all the patients who were prediction to die. The precision-recall curve plots precision as a function of recall for various classification thresholds. The AUPRC is an overall measure of the tradeoff of precision and recall for the model. The ROC curve is a plot of true positive rate against false positive rate for various classification thresholds. The AUROC is an alternative measure of diagnostic accuracy of a model, but is typically more useful when there is not large class imbalance. The F1 score, like the F2 score, is an F-measure. It is defined as the harmonic mean of precision and recall.
The model with the highest F2 score was then tuned to select optimal hyperparameters via a grid search. The tuned model was then calibrated using an isotonic method (36). Baseline models were created using Braden Score and GCS. For each baseline model, the test data set was used to find the threshold of the score that led to the greatest F2 score for classifying patients. The tuned and calibrated model and the baseline models were used to predict mortality on each subset of the test data stratified by the current LOS. Predictions were made using an empirical bootstrapping method using 1,000 iterations with resampling of the test data for each subset to obtain estimates and confidence intervals (CI) for the metrics. We also evaluated the model for patient subsets of total LOS. We then tested the model against sub-populations to uncover potential predictive biases against gender, race, and age group.
Results
Our dataset comprised 176,526 patients, of which 63.7% were white, and 27.3% were black. Slightly over half (55.3%) of patients were female and 44.6% were male (Table 1). A total of 5,275 (3.0%) patients died in the hospital. Most patients (77.6%) were discharged or died by day 6. From day 7 and after, the percentage of patients with a total LOS for any specific number of days became low (0.0–4.0%); therefore, patients with an LOS of seven or more days were reclassified as having an LOS of 7+. We analyzed patients’ mortality rate against their LOS and noted a high mortality rate for patients staying one day. The mortality rate was the lowest on days 2 and 3 (1.432% and 1.437% vs. 2.005–6.027% for remaining days). From day 3, the mortality rate increased as LOS increased. By day 4, 66.5% were discharged alive. Over half (54.9%) of patients who did not survive died by day 6. Figure 2 illustrates the mortality distribution.
Table 1
| Characteristic | Total (n=176,526) | Train (80%) | Test (20%) | |||||
|---|---|---|---|---|---|---|---|---|
| Discharged (n=137,000) | Died in hospital (n=4,220) | Total (n=141,220) | Discharged (n=34,251) | Died in hospital (n=1,055) | Total (n=35,306) | |||
| LOS, mean [IQR], days | 5.6 [2–6] | 5.4 [2–6] | 10.5 [2–13] | 5.6 [2–6] | 5.4 [2–6] | 10.5 [2–13] | 5.6 [2–6] | |
| Age, mean [IQR], years | 52.2 [34–68] | 51.8 [34–67] | 64.4 [56–76] | 52.2 [34–68] | 51.7 [34–67] | 64.8 [56–77] | 52.0 [34–67] | |
| Sex, n (%) | ||||||||
| Female | 97,665 (55.3) | 76,350 (55.7) | 1,807 (42.8) | 78,157 (55.3) | 19,028 (55.6) | 480 (45.5) | 19,508 (55.3) | |
| Male | 78,800 (44.6) | 60,600 (44.2) | 2,413 (57.2) | 63,013 (44.6) | 15,214 (44.4) | 573 (54.3) | 15,787 (44.7) | |
| Unknown | 61 (0.0) | 50 (0.0) | 0 (0.0) | 50 (0.0) | 9 (0.0) | 2 (0.2) | 11 (0.0) | |
| Race, n (%) | ||||||||
| White | 112,524 (63.7) | 87,258 (63.7) | 2,754 (65.3) | 90,012 (63.4) | 21,836 (63.8) | 676 (64.1) | 22,512 (63.8) | |
| Black | 48,131 (27.3) | 37,393 (27.3) | 1,153 (27.3) | 38,546 (27.3) | 9,289 (27.1) | 296 (28.1) | 9,585 (27.1) | |
| Asian | 1,961 (1.1) | 1,519 (1.1) | 28 (1.0) | 1,547 (1.1) | 411 (1.2) | 3 (0.3) | 414 (1.2) | |
| Other | 11,576 (6.6) | 9,076 (6.6) | 151 (3.6) | 9,227 (6.5) | 2,307 (6.7) | 42 (4.0) | 2,349 (6.7) | |
| Unknown | 2,334 (1.3) | 1,754 (1.3) | 134 (1.3) | 1,888 (1.3) | 408 (1.2) | 38 (3.6) | 446 (1.3) | |
| Ethnicity, n (%) | ||||||||
| Not Hispanic | 163,713 (92.7) | 127,050 (92.7) | 3,948 (94.6) | 130,998 (92.8) | 31,733 (92.6) | 982 (93.1) | 32,715 (92.7) | |
| Hispanic | 10,138 (5.7) | 7,949 (5.8) | 121 (2.9) | 8,070 (5.7) | 2,040 (6.0) | 28 (2.7) | 2,068 (5.9) | |
| Unknown | 2,675 (1.5) | 2,001 (1.5) | 151 (1.5) | 2,152 (1.5) | 478 (1.4) | 45 (4.3) | 523 (1.5) | |
LOS, length of stay; no., number; IQR, interquartile range.

The combination of various imputation and resampling methods produced 15 models (Table 2). The CatBoost classifier using mean imputation and an under-sampling strategy of 0.25 followed by oversampling to achieve class balance performed best with an F2 score of 0.506. That model was tuned and calibrated, and the final model, MONITOR, achieved an F2 score of 0.510, a recall of 0.644, and an AUROC of 0.905 (Figure 3 and Table 3). The feature importance analysis showed that the Braden Score and GCS had the highest predictive power, followed by the last heart rate, the last mean arterial pressure, age, and LOS. Tables S3,S4 in the supplementary appendix lists the data features by the cohorts.
Table 2
| Imputation | Resampling | Accuracy | AUROC | Recall | Precision | AUPRC | F1 | F2 |
|---|---|---|---|---|---|---|---|---|
| Mean | Undersampling.25_Oversampling | 0.8979 | 0.9060 | 0.7258 | 0.2283 | 0.3731 | 0.3473 | 0.5055 |
| Mean | Undersampling.50_Oversampling | 0.8821 | 0.9085 | 0.7625 | 0.2074 | 0.3783 | 0.3262 | 0.4967 |
| Mean | Undersampling.25_SMOTE_EEN | 0.8793 | 0.9053 | 0.7607 | 0.2030 | 0.3460 | 0.3205 | 0.4910 |
| Mean | Oversampling | 0.9312 | 0.9007 | 0.5878 | 0.2918 | 0.3613 | 0.3900 | 0.4887 |
| Mean | Undersampling.75_Oversampling | 0.8729 | 0.9085 | 0.7762 | 0.1967 | 0.3756 | 0.3138 | 0.4883 |
| Mean | Undersampling | 0.9310 | 0.9013 | 0.5872 | 0.2910 | 0.3626 | 0.3892 | 0.4879 |
| Iterative | Undersampling.25_SMOTE_EEN | 0.8880 | 0.9005 | 0.7233 | 0.2103 | 0.3456 | 0.3259 | 0.4861 |
| Mean | Undersampling.75_SMOTE_EEN | 0.8812 | 0.8994 | 0.7374 | 0.2021 | 0.3308 | 0.3173 | 0.4821 |
| Mean | Undersampling.50_SMOTE_EEN | 0.8729 | 0.9017 | 0.7631 | 0.1946 | 0.3378 | 0.3101 | 0.4817 |
| Iterative | Undersampling | 0.8651 | 0.9076 | 0.7815 | 0.1876 | 0.3682 | 0.3025 | 0.4785 |
| Iterative | Undersampling.50_SMOTE_EEN | 0.8816 | 0.8939 | 0.7268 | 0.2010 | 0.3281 | 0.3149 | 0.4772 |
| Iterative | Oversampling | 0.9325 | 0.8984 | 0.5623 | 0.2916 | 0.3521 | 0.3840 | 0.4743 |
| Iterative | Undersampling.75_SMOTE_EEN | 0.8838 | 0.8886 | 0.7037 | 0.2003 | 0.3291 | 0.3119 | 0.4683 |
| Mean | SMOTE | 0.9571 | 0.9029 | 0.3585 | 0.4160 | 0.3607 | 0.3851 | 0.3687 |
| Iterative | SMOTE | 0.9602 | 0.9061 | 0.3354 | 0.4564 | 0.3747 | 0.3867 | 0.3542 |
AUROC, area under the receiver operating characteristic curve; AUPRC, area under the precision-recall curve.

Table 3
| Model | CatBoost model | Tuned CatBoost model | Calibrated tuned CatBoost (MONITOR) model |
|---|---|---|---|
| AUROC | 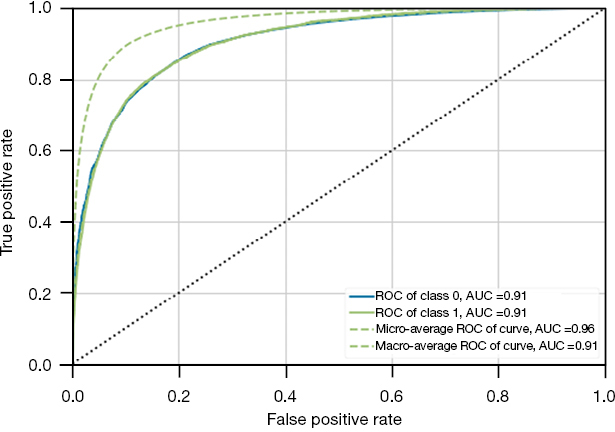 |
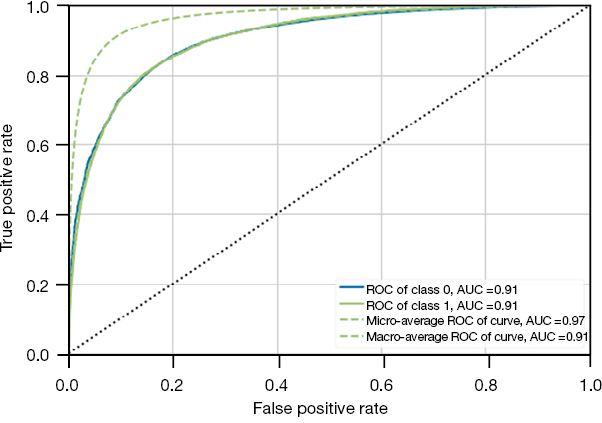 |
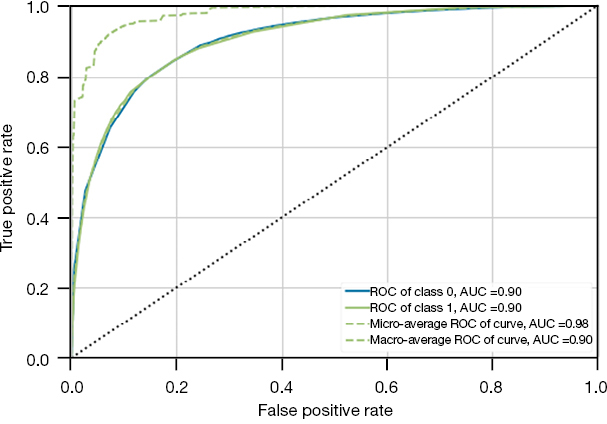 |
| 0.9072 | 0.9065 | 0.9047 | |
| PRC | 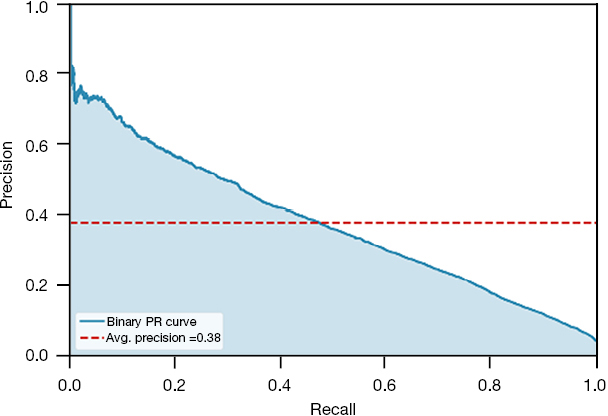 |
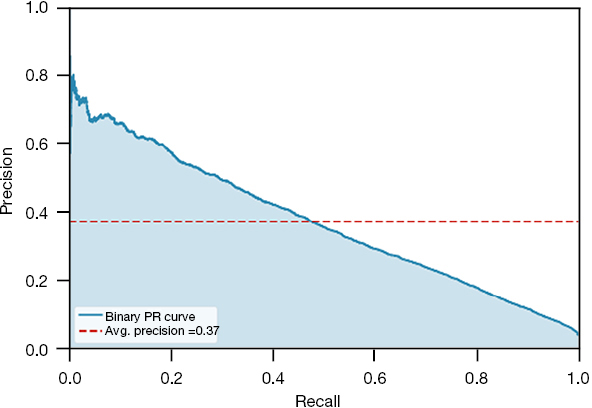 |
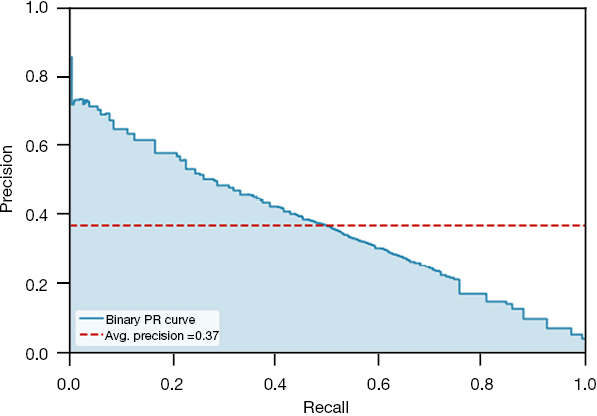 |
| 0.3751 | 0.3702 | 0.3663 | |
| Accuracy | 0.8975 | 0.9091 | 0.9240 |
| Recall | 0.7278 | 0.6890 | 0.6442 |
| Precision | 0.2279 | 0.2454 | 0.2778 |
| F1 | 0.3471 | 0.3619 | 0.3881 |
| F2 | 0.5059 | 0.5061 | 0.5097 |
AUROC, area under the receiver operating characteristic curve; PRC, precision-recall curve.
We established the performance metrics for the GCS Score, Braden Score, and MONITOR models for each day of stay. MONITOR systematically outperformed the score-based models for F2 score (0.466–0.543), recall (0.729–0.759), AUROC (0.889–0.920), and AUPRC (0.362–0.391). Figure 4 illustrate the comparison between the three models. The detailed performance metrics between the three models can be found in Table S5 of the supplementary appendix online.

Figure 5 shows how F2 score varies by day when patients are grouped by total LOS. The F2 score is highest for patients on day 1 or with a total LOS of one day (0.811) and lowest for patients with a total LOS of seven or more days (0.380). For patients with staying seven or more days, the F2 score increases to 0.543 for predictions made on day 7. Similar trends in increasing scores are observed for other subgroups for all of the reported metrics (Figure 5).

The subgroup analysis revealed no statistical differences between age, race, and sex; with the exception in sex on days 5 and 6 (Figure 6). The F2 score for males on day 5 was 0.490 (0.454–0.528) whereas 0.579 (0.540–0.618) for females. The F2 score for males on day 6 was 0.515 (0.475–0.553) whereas 0.577 (0.536–0.617) for females.

Discussion
The adoption of EHRs has increased the availability of data, facilitating the uptake of ML approaches in the healthcare setting (37). Enhancing EHRs with modern data visualizations and multi-domain machine learning can provide a 360-degree view of the patient, provider, hospital, and healthcare system to better understand and act upon mortality risk throughout the patient’s hospital stay. However, many ML approaches to date for predicting mortality are limited to a specific setting (e.g., the ICU), conditions (e.g., sepsis), or procedures (e.g., PCI) at a singular moment in time. Because clinicians evaluate a patient’s conditions throughout his/her hospital stay, the same time-varying approach should be applied when evaluating mortality risk. Therefore, we developed an ML model to predict mortality risk throughout a patient’s hospital stay.
Previously published models that predicted in-hospital mortality at the time of admission achieved an AUROC of 0.84–0.94 (24,38-40). In addition to using data from the entire LOS to train our model, we also updated our predictions each day as new time-series data became available. Models trained on time-series data have demonstrated increased predictive ability (25). For patients that had longer LOS, it was more difficult to ascertain the discharge outcome early during the patient’s stay. However, the model’s performance increased as more data became available. Another main difference between our model and prior studies is that we selected the F2 measure to rank the different models instead of AUROC. Real-world datasets can exhibit imbalanced class distributions, especially in mortality where there is a binary minority class. Using the F-measure instead of accuracy can be more useful when dealing with class imbalance (41). Furthermore, the F2 measure balances precision and recall with more attention towards minimizing false negatives, considering the grave consequences of failing to identify an at-risk patient. For the same reason, other studies also optimized the F-measure in developing their models (42,43).
Healthcare professionals have been using medical calculations and scores as part of clinical decision tools for decades. Both the Braden Score and GCS, among other scoring systems, are integral parts of clinical practice, albeit not intended originally as mortality risk prediction scores. The Braden Scale is used to assess pressure-injury risk in various healthcare settings. A GCS assessment is done to determine a patients’ level of consciousness. However, both the Braden and GCS have been expanded to predict mortality in different studies (44-48). Even though the Braden and GCS scores were the highest ranked individual features in our model, our results suggested a more holistic ML approach is better as it has the ability to capture data spanning various clinical functions, including sequential time series temporal trends.
Our study has several limitations to consider. Lab and vital sign measurements were only included in the data if they occurred after an inpatient designation status for a patient. Data collected before patient handoff from other departments (e.g., emergency department) might be insightful but were discarded with our methodology. Additionally, we omitted several other possible predictors, including missingness indicators and features from clinical notes that other studies have shown to be helpful. Our choice of statistics for time-series data (first, last, maximum, minimum, mean, and SD) was also limited, and more sophisticated techniques may have led to better model performance. Our model was also impacted by incomplete patient records and missing data. Alternatively, other models such as recurrent neural networks or LSTMs may be utilized to capture signals from time series data that may retain some more clinically meaningful variations. The output of these models can be used as features in the final Catboost model. While different imputation types were utilized, more complete patient records would provide better results. Additionally, we assigned the survival outcome to each patient in the training dataset associated with the occurrence of a discharge event. However, in practice and in the LOS-stratified test set, patients may experience several events, including discharge, mortality, a continuation of stay, or departmental transfer. Although we believe that the use of F2 measure over AUROC as the guiding metric is more indicative of the real impact of misclassifications in the hospital setting, we were unable to validate our decision without a complete cost-benefit analysis. The tradeoff between false positives and false negatives may depend on the current conditions and constraints of each hospital and need to be evaluated on an individual basis.
Conclusions
This study investigated an ML model that can be utilized for both ICU and non-ICU inpatient mortality. Though limited to a single institution, it performs equally well regardless of patient demographics. Additionally, it accounts for the change in patient condition as the patient continues to stay in the hospital. Moving forward, the model needs to be validated internally with prospective data as well as externally to determine how the model performs with other patient cohorts. Further implementation research is required to understand how we can integrate this model with clinical workflow in order for this model to be impactful in an operational setting.
Acknowledgments
We acknowledge the University of Florida (UF) Integrated Data Repository (IDR) and the UF Health Office of the Chief Data Officer for providing the analytic data set for this project.
Funding: None.
Footnote
Reporting Checklist: The authors have completed the TRIPOD reporting checklist. Available at https://jmai.amegroups.com/article/view/10.21037/jmai-21-28/rc
Data Sharing Statement: Available at https://jmai.amegroups.com/article/view/10.21037/jmai-21-28/dss
Conflicts of Interest: All authors have completed the ICMJE uniform disclosure form (available at https://jmai.amegroups.com/article/view/10.21037/jmai-21-28/coif). The authors have no conflicts of interest to declare.
Ethical Statement:
Open Access Statement: This is an Open Access article distributed in accordance with the Creative Commons Attribution-NonCommercial-NoDerivs 4.0 International License (CC BY-NC-ND 4.0), which permits the non-commercial replication and distribution of the article with the strict proviso that no changes or edits are made and the original work is properly cited (including links to both the formal publication through the relevant DOI and the license). See: https://creativecommons.org/licenses/by-nc-nd/4.0/.
References
- Hall MJ, Levant S, DeFrances CJ. Trends in Inpatient Hospital Deaths: National Hospital Discharge Survey, 2000–2010. NCHS Data Brief 2013. Available online: https://www.cdc.gov/nchs/data/databriefs/db118.pdf
- Chang SH, Hsieh CH, Weng YM, et al. Performance Assessment of the Mortality in Emergency Department Sepsis Score, Modified Early Warning Score, Rapid Emergency Medicine Score, and Rapid Acute Physiology Score in Predicting Survival Outcomes of Adult Renal Abscess Patients in the Emergency Department. Biomed Res Int 2018;2018:6983568. [Crossref] [PubMed]
- Brink A, Alsma J, Verdonschot RJCG, et al. Predicting mortality in patients with suspected sepsis at the Emergency Department; A retrospective cohort study comparing qSOFA, SIRS and National Early Warning Score. PLoS One 2019;14:e0211133. [Crossref] [PubMed]
- Ferreira FL, Bota DP, Bross A, et al. Serial evaluation of the SOFA score to predict outcome in critically ill patients. JAMA 2001;286:1754-8. [Crossref] [PubMed]
- Corey KM, Kashyap S, Lorenzi E, et al. Development and validation of machine learning models to identify high-risk surgical patients using automatically curated electronic health record data (Pythia): A retrospective, single-site study. PLoS Med 2018;15:e1002701. [Crossref] [PubMed]
- El-Manzalawy Y, Abbas M, Hoaglund I, et al. OASIS+: leveraging machine learning to improve the prognostic accuracy of OASIS severity score for predicting in-hospital mortality. BMC Med Inform Decis Mak 2021;21:156. [Crossref] [PubMed]
- Sadeghi R, Banerjee T, Romine W. Early Hospital Mortality Prediction using Vital Signals. Smart Health (Amst) 2018;9-10:265-74. [Crossref] [PubMed]
- Johnson AEW, Mark RG. Real-time mortality prediction in the Intensive Care Unit. AMIA Annu Symp Proc 2018;2017:994-1003. [PubMed]
- Zhang D, Yin C, Zeng J, et al. Combining structured and unstructured data for predictive models: a deep learning approach. BMC Med Inform Decis Mak 2020;20:280. [Crossref] [PubMed]
- Harutyunyan H, Khachatrian H, Kale DC, et al. Multitask learning and benchmarking with clinical time series data. Sci Data 2019;6:96. [Crossref] [PubMed]
- Purushotham S, Meng C, Che Z, et al. Benchmarking deep learning models on large healthcare datasets. J Biomed Inform 2018;83:112-34. [Crossref] [PubMed]
- Pirracchio R, Petersen ML, Carone M, et al. Mortality prediction in intensive care units with the Super ICU Learner Algorithm (SICULA): a population-based study. Lancet Respir Med 2015;3:42-52. [Crossref] [PubMed]
- Johnson AE, Pollard TJ, Shen L, et al. MIMIC-III, a freely accessible critical care database. Sci Data 2016;3:160035. [Crossref] [PubMed]
- Motwani M, Dey D, Berman DS, et al. Machine learning for prediction of all-cause mortality in patients with suspected coronary artery disease: a 5-year multicentre prospective registry analysis. Eur Heart J 2017;38:500-7. [PubMed]
- Taylor RA, Pare JR, Venkatesh AK, et al. Prediction of In-hospital Mortality in Emergency Department Patients With Sepsis: A Local Big Data-Driven, Machine Learning Approach. Acad Emerg Med 2016;23:269-78. [Crossref] [PubMed]
- Moll M, Qiao D, Regan EA, et al. Machine Learning and Prediction of All-Cause Mortality in COPD. Chest 2020;158:952-64. [Crossref] [PubMed]
- Hernandez-Suarez DF, Kim Y, Villablanca P, et al. Machine Learning Prediction Models for In-Hospital Mortality After Transcatheter Aortic Valve Replacement. JACC Cardiovasc Interv 2019;12:1328-38. [Crossref] [PubMed]
- Al'Aref SJ, Singh G, van Rosendael AR, et al. Determinants of In-Hospital Mortality After Percutaneous Coronary Intervention: A Machine Learning Approach. J Am Heart Assoc 2019;8:e011160. [Crossref] [PubMed]
- Li Y, Chen M, Lv H, et al. A novel machine-learning algorithm for predicting mortality risk after hip fracture surgery. Injury 2021;52:1487-93. [Crossref] [PubMed]
- Centers for Disease Control and Prevention, National Center for Health Statistics. Underlying cause of death 1999-2019 on CDC WONDER Online Database, released in 2020. Data are from the Multiple Cause of Death Files, 1999-2019, as compiled from data provided by the 57 vital statistics jurisdictions through the Vital Statistics Cooperative Program. Available online: http://wonder.cdc.gov/ucd-icd10.html
- Saliba P, Hornero A, Cuervo G, et al. Mortality risk factors among non-ICU patients with nosocomial vascular catheter-related bloodstream infections: a prospective cohort study. J Hosp Infect 2018;99:48-54. [Crossref] [PubMed]
- Nemer DM, Wilner BR, Burkle A, et al. Clinical Characteristics and Outcomes of Non-ICU Hospitalization for COVID-19 in a Nonepicenter, Centrally Monitored Healthcare System. J Hosp Med 2021;16:7-14. [Crossref] [PubMed]
- Raita Y, Goto T, Faridi MK, et al. Emergency department triage prediction of clinical outcomes using machine learning models. Crit Care 2019;23:64. [Crossref] [PubMed]
- Brajer N, Cozzi B, Gao M, et al. Prospective and External Evaluation of a Machine Learning Model to Predict In-Hospital Mortality of Adults at Time of Admission. JAMA Netw Open 2020;3:e1920733. [Crossref] [PubMed]
- Shickel B, Loftus TJ, Adhikari L, et al. DeepSOFA: A Continuous Acuity Score for Critically Ill Patients using Clinically Interpretable Deep Learning. Sci Rep 2019;9:1879. [Crossref] [PubMed]
- National Bureau of Economic Research (NBER). ICD-9-CM to and from ICD-10-CM And ICD-10-PCS crosswalk or general equivalence mappings. Cambridge, MA, USA: NBER, 2016. Available online: https://www.nber.org/research/data/icd-9-cm-and-icd-10-cm-and-icd-10-pcs-crosswalk-or-general-equivalence-mappings
- Agency for Healthcare Research and Quality (AHRQ). HCUP tools and software. Rockville, MD, USA: AHRQ, 2021. Available online: https://www.hcup-us.ahrq.gov/tools_software.jsp
- World Health Organization Collaborating Center (WHOCC). ATC/DDD index 2021. Oslo: WHOCC, 2020. Available online: https://www.whocc.no/atc_ddd_index/
- Cohen A. Python Package Index (PyPI). Fuzzywuzzy 0.18.
0. 2011. Available online: https://pypi.org/project/fuzzywuzzy/ - Chieregato M, Frangiamore F, Morassi M, et al. A hybrid machine learning/deep learning COVID-19 severity predictive model from CT images and clinical data. arXiv 2021. Available online: https://arxiv.org/pdf/2105.06141.pdf
- Kleiman MJ, Barenholtz E, Galvin JE, et al. Screening for Early-Stage Alzheimer's Disease Using Optimized Feature Sets and Machine Learning. J Alzheimers Dis 2021;81:355-66. [Crossref] [PubMed]
- Andersson P, Johnsson J, Björnsson O, et al. Predicting neurological outcome after out-of-hospital cardiac arrest with cumulative information; development and internal validation of an artificial neural network algorithm. Crit Care 2021;25:83. [Crossref] [PubMed]
- Prokhorenkova L, Gusev G, Vorobev A, et al. CatBoost: unbiased boosting with categorical features. NIPS'18: Proceedings of the 32nd International Conference on Neural Information Processing Systems. Red Hook, NY, USA: Curran Associates Inc., 2018:6639-49. Available online:
https://dl.acm.org/doi/abs/10.5555/3327757.3327770 - Hancock JT, Khoshgoftaar TM. CatBoost for big data: an interdisciplinary review. J Big Data 2020;7:94. [Crossref] [PubMed]
- Chawla NV, Bowyer KW, Hall LO, et al. SMOTE: Synthetic minority over-sampling technique. J Artif Intell Res 2002;16:321-57. [Crossref]
- Batista GE, Bazzan AL, Monard MC. Balancing training data for automated annotation of keywords: A case study. WOB 2003:10. Available online: https://citeseerx.ist.psu.edu/viewdoc/download?doi=10.1.1.10.2192&rep=rep1&type=pdf
- Niculescu-Mizil A, Caruana RA. Obtaining calibrated probabilities from boosting. arXiv 2012. Available online: https://arxiv.org/ftp/arxiv/papers/1207/1207.1403.pdf
- Bates DW, Saria S, Ohno-Machado L, et al. Big data in health care: using analytics to identify and manage high-risk and high-cost patients. Health Aff (Millwood) 2014;33:1123-31. [Crossref] [PubMed]
- Seki T, Kawazoe Y, Ohe K. Machine learning-based prediction of in-hospital mortality using admission laboratory data: A retrospective, single-site study using electronic health record data. PLoS One 2021;16:e0246640. [Crossref] [PubMed]
- Rajkomar A, Oren E, Chen K, et al. Scalable and accurate deep learning with electronic health records. NPJ Digit Med 2018;1:18. [Crossref] [PubMed]
- Soffer S, Klang E, Barash Y, et al. Predicting In-Hospital Mortality at Admission to the Medical Ward: A Big-Data Machine Learning Model. Am J Med 2021;134:227-234.e4. [Crossref] [PubMed]
- Liu Meng, Xu Chang, Luo Yong, et al. Cost-Sensitive Feature Selection by Optimizing F-Measures. IEEE Trans Image Process 2018;27:1323-35. [Crossref] [PubMed]
- Shah V, Turkbey B, Mani H, et al. Decision support system for localizing prostate cancer based on multiparametric magnetic resonance imaging. Med Phys 2012;39:4093-103. [Crossref] [PubMed]
- Khajehali N, Khajehali Z, Tarokh MJ. The prediction of mortality influential variables in an intensive care unit: a case study. Pers Ubiquitous Comput 2021; Epub ahead of print. [Crossref] [PubMed]
- Bandle B, Ward K, Min SJ, et al. Can Braden Score Predict Outcomes for Hospitalized Heart Failure Patients? J Am Geriatr Soc 2017;65:1328-32. [Crossref] [PubMed]
- Jentzer JC, Anavekar NS, Brenes-Salazar JA, et al. Admission Braden Skin Score Independently Predicts Mortality in Cardiac Intensive Care Patients. Mayo Clin Proc 2019;94:1994-2003. [Crossref] [PubMed]
- Yousefifard M, Shahsavarinia K, Faridaalee G, et al. Comparison of Glasgow Coma Scale with physiologic scoring scales in prediction of in-hospital outcome of trauma patients: a diagnostic accuracy study. Front Emerg Med 2020;4:e89.
- Weingarten S, Bolus R, Riedinger MS, et al. The principle of parsimony: Glasgow Coma Scale score predicts mortality as well as the APACHE II score for stroke patients. Stroke 1990;21:1280-2. [Crossref] [PubMed]
Cite this article as: Guerrier CC, D’Acunto SJ, Labilloy GPL, Esma RA, Kendall HA, Norez DA, Fishe JN. MONITOR: a multi-domain machine learning approach to predicting in-hospital mortality. J Med Artif Intell 2022;5:3.

